Interactive Map
Interactive Map is the core feature of GIS Server, providing powerful tools for viewing, and analyzing geospatial data. The mapping interface supports topographic layers, aerial imagery, and other mapping resources with advanced visualization capabilities.
Map Interface Overview
Section titled “Map Interface Overview”The interactive map interface provides an intuitive, web-based environment for exploring and analyzing geographic data. Built with modern web technologies, it offers smooth navigation, real-time updates, and responsive design across all devices.
Key Features
Section titled “Key Features”The mapping system provides a comprehensive set of features designed to handle various types of geospatial data and user requirements.
Multi-Layer Support
Section titled “Multi-Layer Support”- Base Maps: Multiple basemap options including satellite, street, and topographic views
- Data Layers: Overlay multiple datasets simultaneously
- Layer Management: Control visibility, opacity, and stacking order
- Dynamic Loading: Load layers on-demand for optimal performance
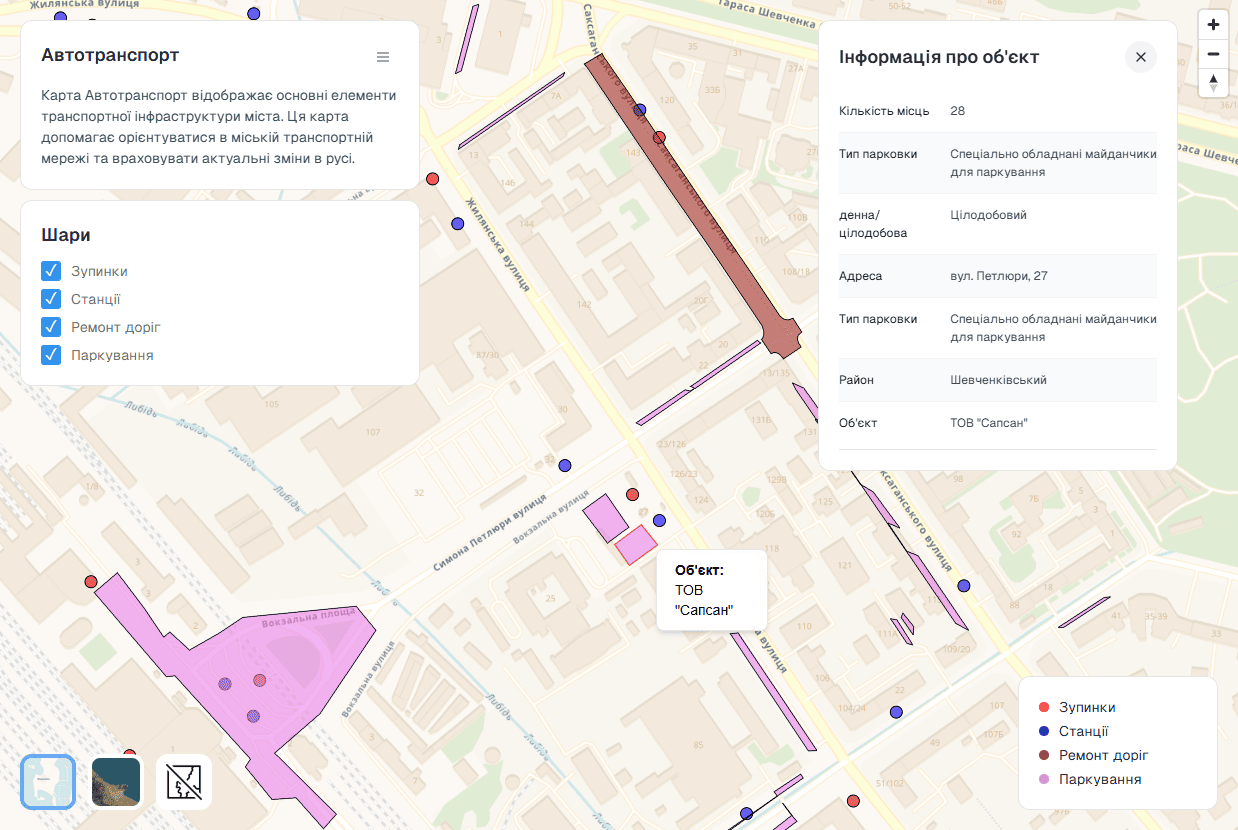
Interactive Elements
Section titled “Interactive Elements”- Object Cards: Detailed information panels for selected features
- Popups: Context-sensitive information displays
- Hover Effects: Preview information without clicking
Clustering
Section titled “Clustering”- Automatic Clustering: Group nearby points at different zoom levels
- Performance Optimization: Handle datasets with a large number of objects
Widgets
Section titled “Widgets”GIS Server provides a comprehensive set of widgets to enhance the mapping experience. These widgets offer specialized functionality for different aspects of map interaction and data exploration.
Legend
Section titled “Legend”- Purpose: Display symbology and layer information
Base Map
Section titled “Base Map”- Purpose: Switch between different background maps
- Options: Satellite, street, topographic, custom imagery
Object List
Section titled “Object List”- Purpose: Browse and search features in datasets
Info Panel
Section titled “Info Panel”- Purpose: Display detailed information about selected features
Layers
Section titled “Layers”- Purpose: Manage layer visibility and properties
- Features: Toggle visibility, adjust opacity, reorder layers
Catalog
Section titled “Catalog”- Purpose: Browse available datasets and layers
- Features: Search, filter, preview, add to map
- Metadata: Display dataset information and descriptions
Attribute Style
Section titled “Attribute Style”- Purpose: Configure visual styling based on data attributes
- Features: Color coding, size variation, symbol selection
- Real-time: Instant visual updates
Filters
Section titled “Filters”- Purpose: Apply spatial and attribute filters
- Features: Geographic boundaries, attribute conditions, time ranges
- Performance: Optimized filtering for large datasets
Map Styles
Section titled “Map Styles”For more information about the styles, please visit the Map Styles section.
Related Documentation
Section titled “Related Documentation”Explore these related sections to learn more about map functionality and integration: